


F-HUNTERS OBSERVING CAMPAIGN
Are you an amateur of solar observations? Do you have equipment suitable for safe solar observations? Are you interested in solar astrophotography and image processing techniques? Are you amazed by majestic power of solar flares and eruptions? Do you want to contribute to the database of amateur observations dedicated solely to these explosive phenomena in solar atmosphere? If you answered “yes” to at least some of these questions, participate in F-HUNTERS observation campaign and start your hunt for flares today!

F-Chroma Synoptic Summary
Space Weather is just as unpredictable as weather on our planet Earth. However, numerous tools exist that solar physicists use for monitoring of current solar conditions. Some of these tools, presented below, will help in predicting good periods for flare hunting, as well as in identifying photographed events.
GOES X-ray Flux

Solar flares are associated with strong bursts of X-ray radiation. Instrument that has become a standard in measurement of total solar X-ray flux are series of GOES satellites that register radiation from entire solar disk in two channels: less energetic (soft) in range 1-8 Angstrom and more energetic (hard) in range 0.5-4 Angstrom. Solar flares are classified according to their maximum flux value in soft (1-8A -- red curve) GOES channel. (See the letter scale at the right side of the plot.) C-class flares are considered mid-level. However, they still appear very bright even in smallest H-alpha telescopes. X-class flares are the strongest events our Sun is able to produce.
Live Images
Solar Dynamics Observatory is one of the most advanced observatories used by solar physics scientists nowadays. It's well-calibrated high resolution instruments transmit images of the solar disk so frequently that each day of observation produces 1.5 terrabyte of data (1500 gigabytes).
White light (SDO/HMI)
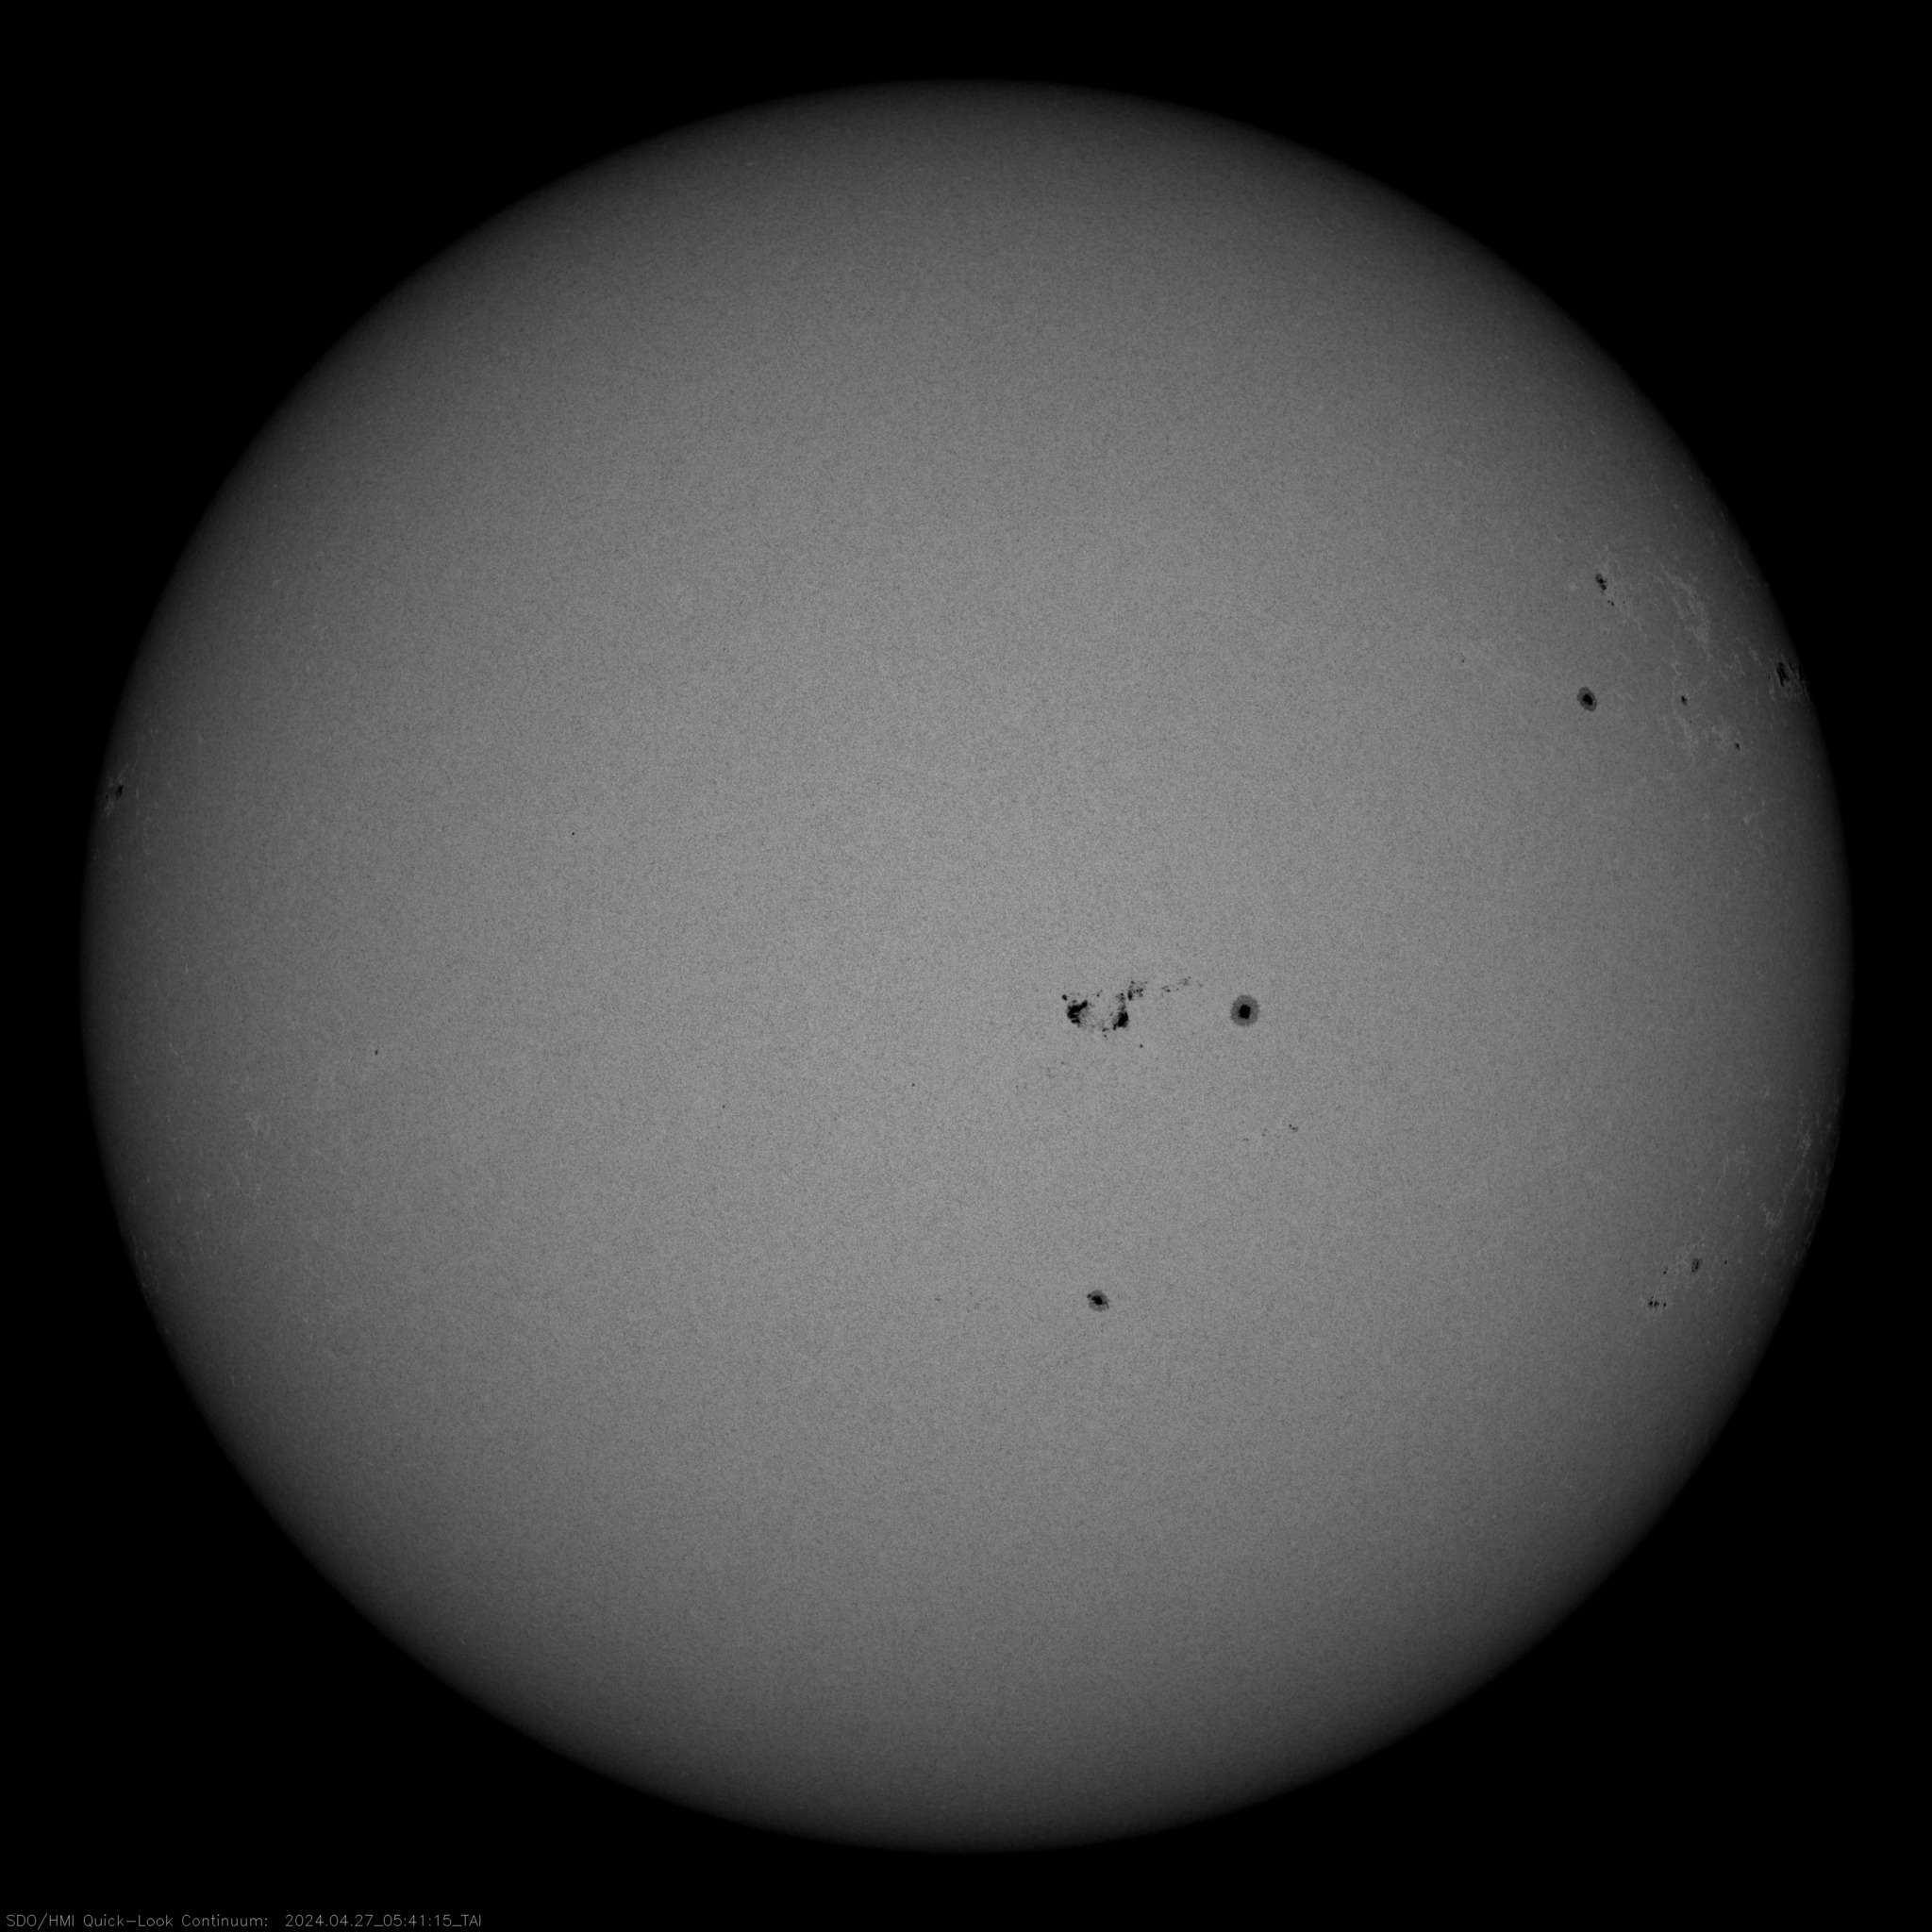
This image shows continuum emission of the photosphere -- extremely luminous layer of the Sun where most of the visible radiation is produced. Granulation and limb darkening is visible. If Sun is active, one can also notice dark sunspots and bright faculae.
GONG H-alpha

H-alpha line is one of the most prominent lines in solar spectrum. Active regions around sunspots, where plasma is hotter, appear as bright plages. Prominences, clumps of cool plasma at temperature about 10000K trapped by magnetic field, appear as long dark threads over the surface or bright “clouds” above the limb.
SDO/AIA 304 Angstrom
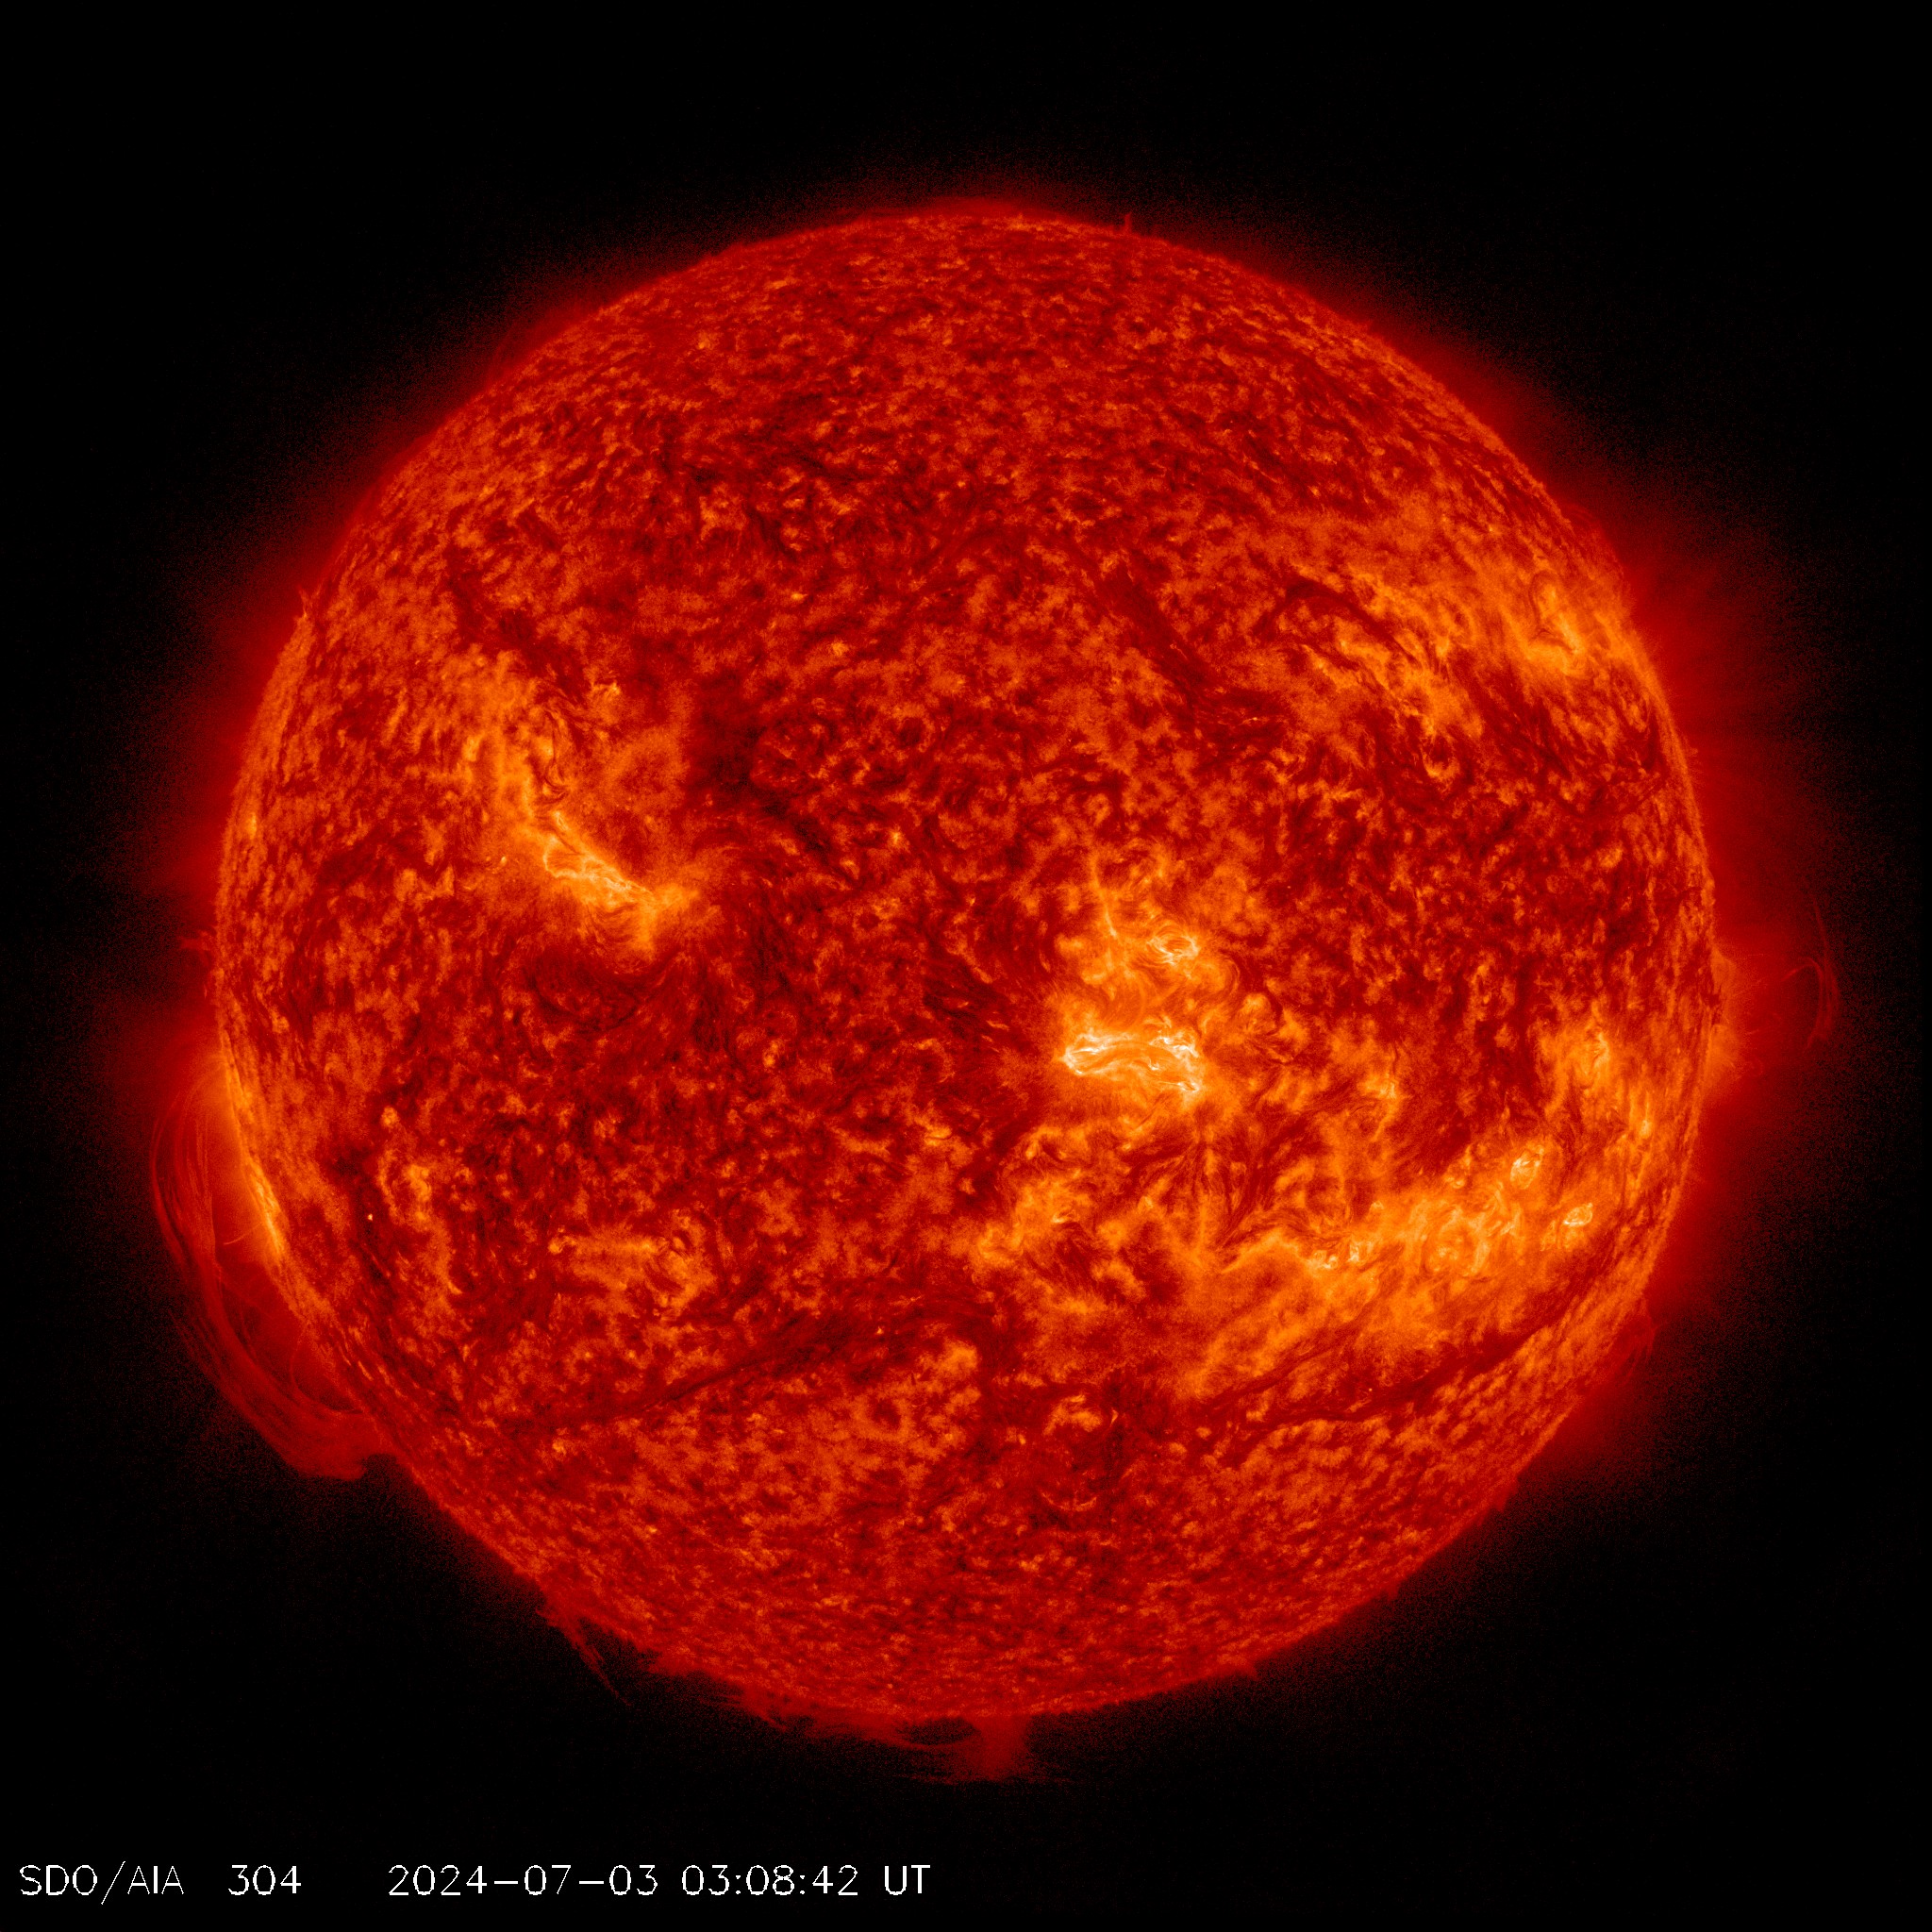
This singly ionized Helium (He-II) line is emitted by plasma at temperature of about 80000K. It shows the chromosphere with all its features: prominences, spiculae, plages. If a flare happens, it forms two bright ribbons, followed by an arcade of post-flare loops a few hours later.
SDO/AIA 1600 Angstrom

This wavelength captures the lower part of solar atmosphere at temperatures about 6000K. The filter is centered around C-IV (triple ionized carbon) line at 160 nm. During a flare, hot plasma at about 100000 K causes strong emission in this line, making flare ribbons easily visible against the darker background.
SDO/AIA Tricolor map

Images from 3 filters (193A - blue, 335A - green, 94A - red) were combined, corresponding to temperatures of 1,3 milion K, 2,8 MK and 6 MK, respectively. One can easily see hotter (red) and cooler (dark blue) regions in the corona.
SDO/HMI Magnetogram + PFSS field
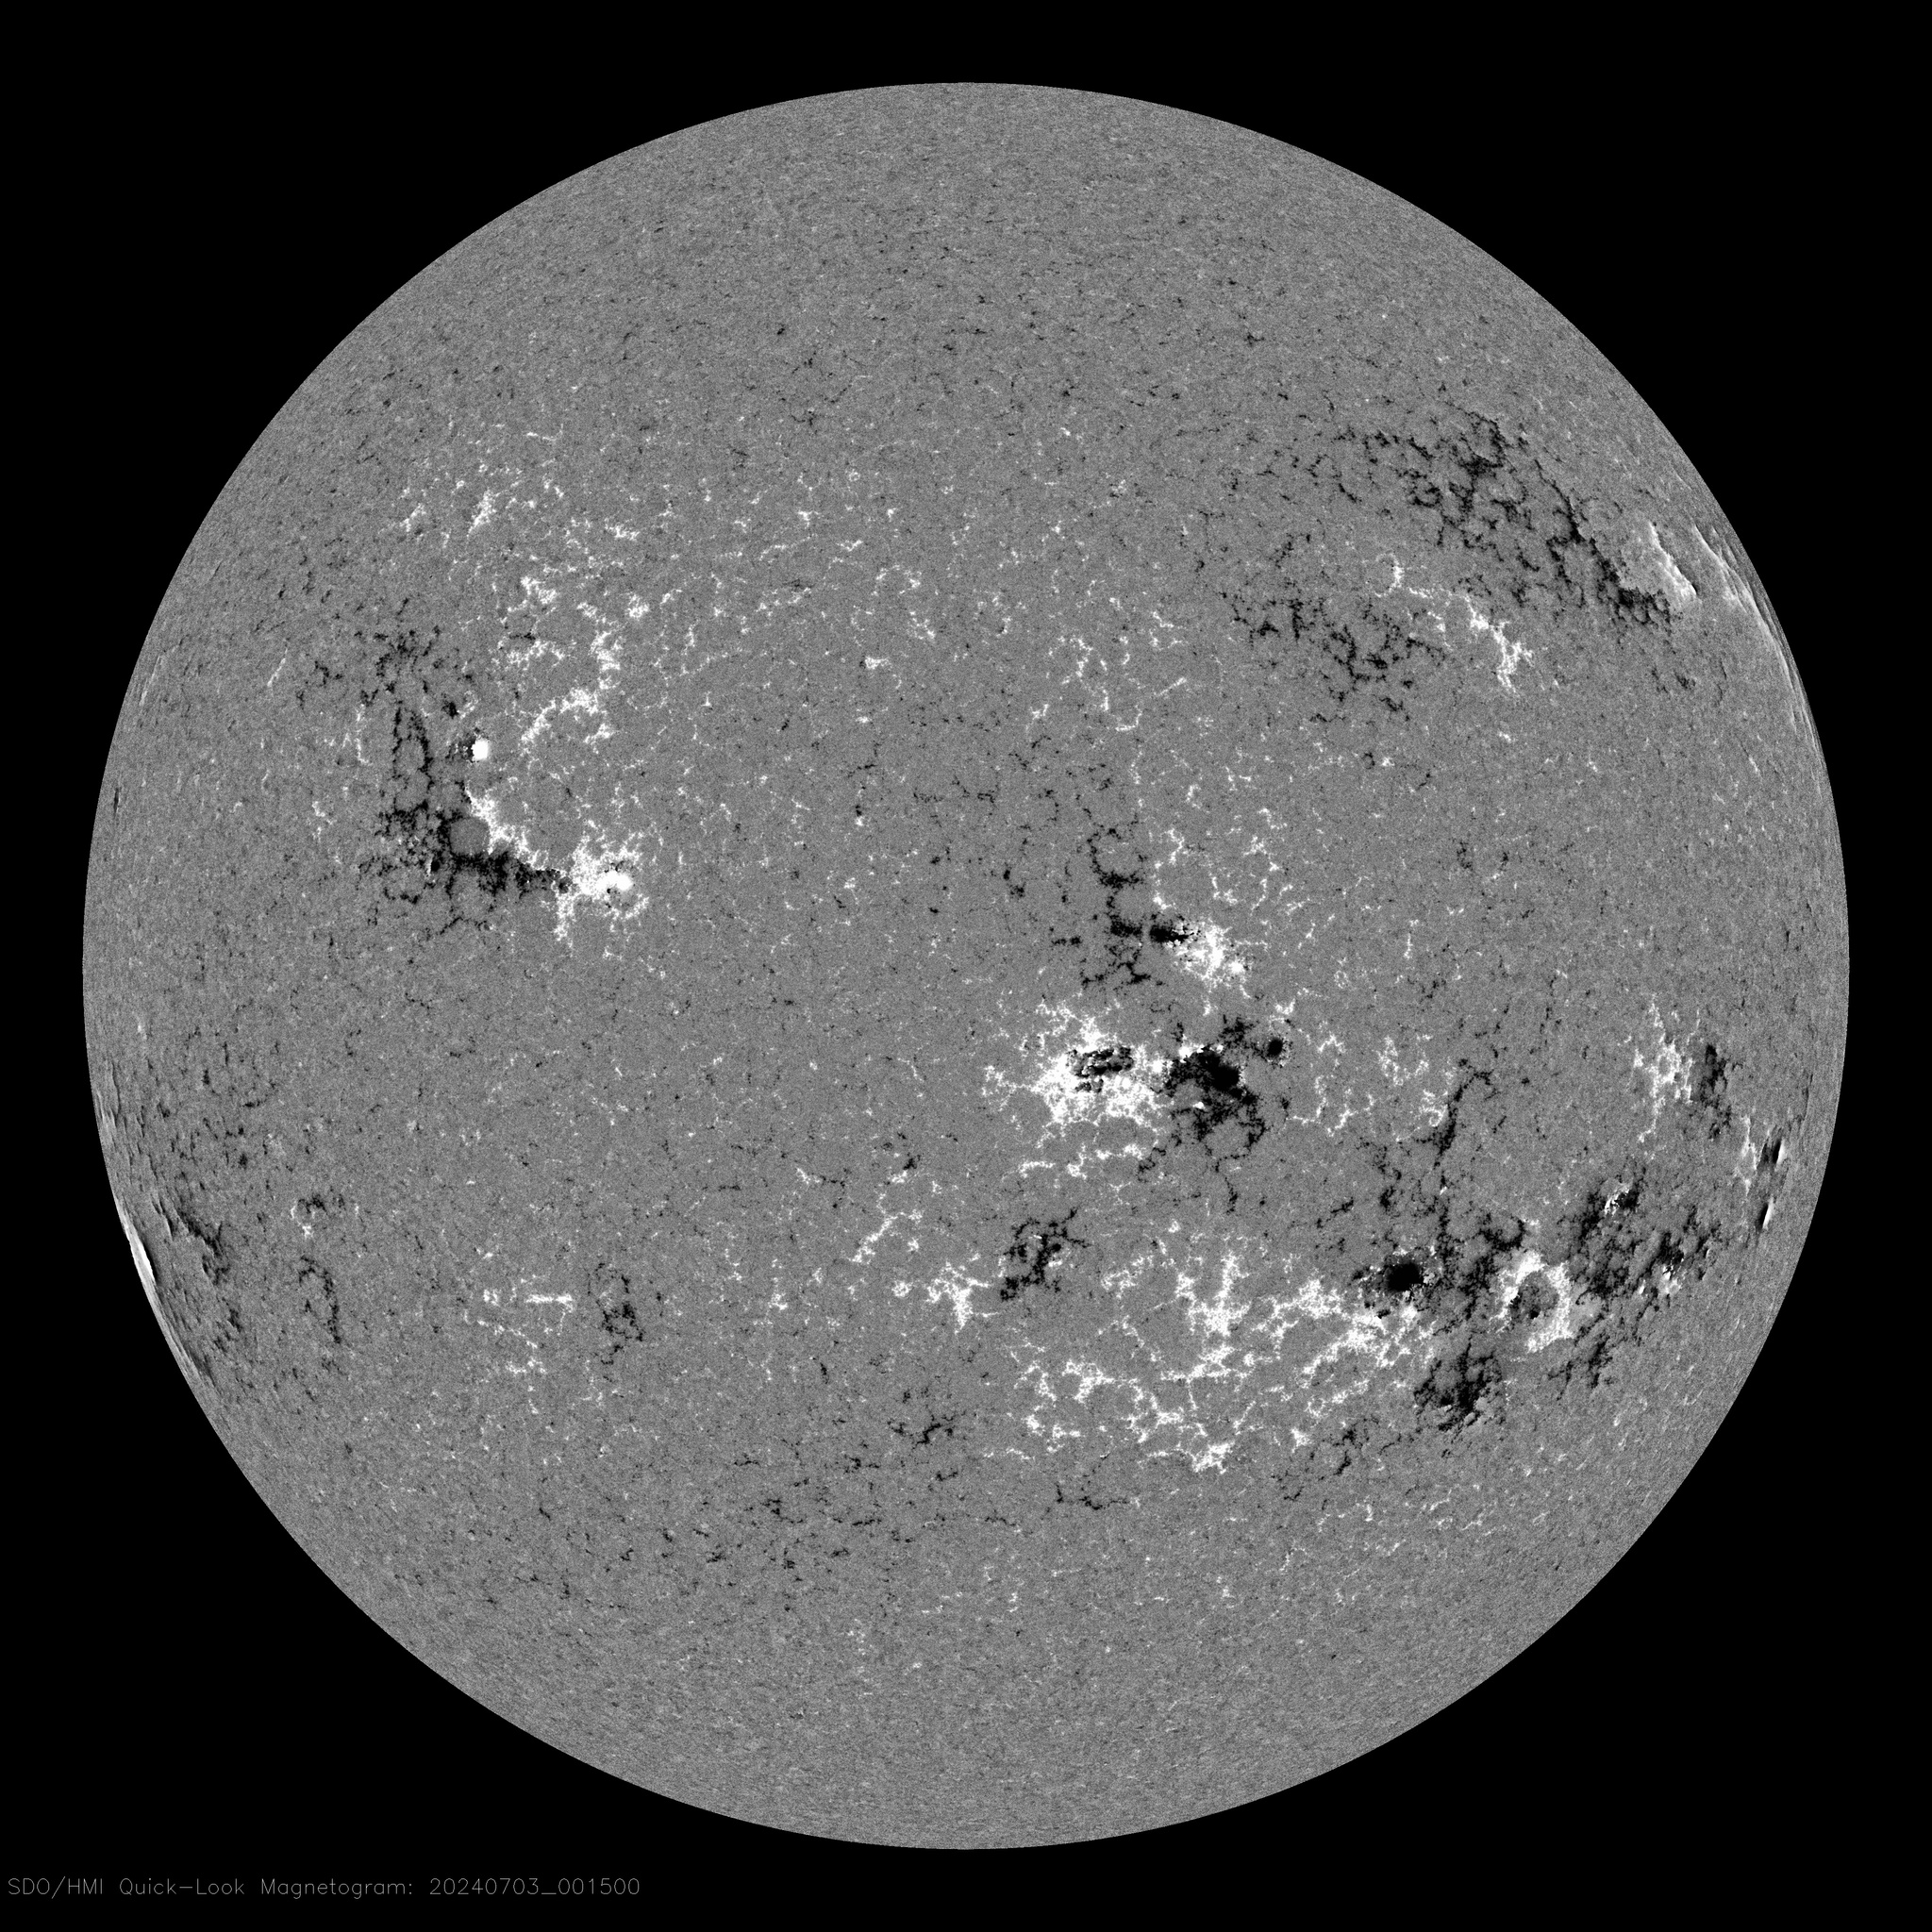
This is a map of solar surface magnetic field (magnetogram), obtained using physical principle called Zeeman effect. White and black spots mark opposite magnetic poles on the solar surface, while grey area is roughly neutral. This information was used to compute magnetic field lines in the corona using theoretical model (plotted with lines).
Online Tools
There are many tools that an observer can use to monitor current situation on the Sun. We selected a few and present them below. Big brown buttons will run the tool in a new window.
Solar Monitor
Solar Monitor is a perfect site to be the home site in your web browser. On the front page there is a compact presentation of most recent images in several wavelengths from both space and ground-based observatories. Images are overlaid with grids and active region numbers. Using the arrow keys or search box, you can navigate through extended data archive. Site has also an up-to-date active region list. A very interesting feature is Flare Forecast, which gives the estimated probability of flare occurence in each visible active region.

Helioviewer Project
Helioviewer is an online, javascript-based application designed for easy browsing, manipulation and mixing near real-time images from many missions (SDO, SOHO, STEREO, PROBA2, YOHKOH). There is also downloadable version called JHelioViewer. This intuitive and easy to use tool enables you to see solar phenomena in stunning detail, as well as generate movies from image sequences.
LMSAL Latest Events
Despite its old-fashioned design, this webpage is a powerful tool for advanced amateurs. Important values, such as X-ray radiation flux, solar wind speed and energy, magnetic field vector and other parameters are plotted on time axis. All events (such as flares) are marked on X-ray lightcurve. Click on upper index, and you're given flare summary. Click on "AIA" label, and you're taken to place where high-resolution movies of the event in several ultaviolet filters are generated and waiting to be seen.

LMSAL iSolSearch
A graphical tool to browse the Heliophysics Event Knowledge (HEK) database.
Other links
- University of Wrocław, Astronomical Institute
- EIT Movies -- University of Wrocław, Astronomical Institute
- X-ray fluxes -- SWPC
- X-ray movies -- SWPC
- Planetary K index -- SWPC
- Aurora Forecast -- SWPC
prepared by Dominik Gronkiewicz